VicAnalytics™ 2.0

AP analytics that drive decisions

One dashboard for CFOs, controllers and AP teams, with every number defined once.
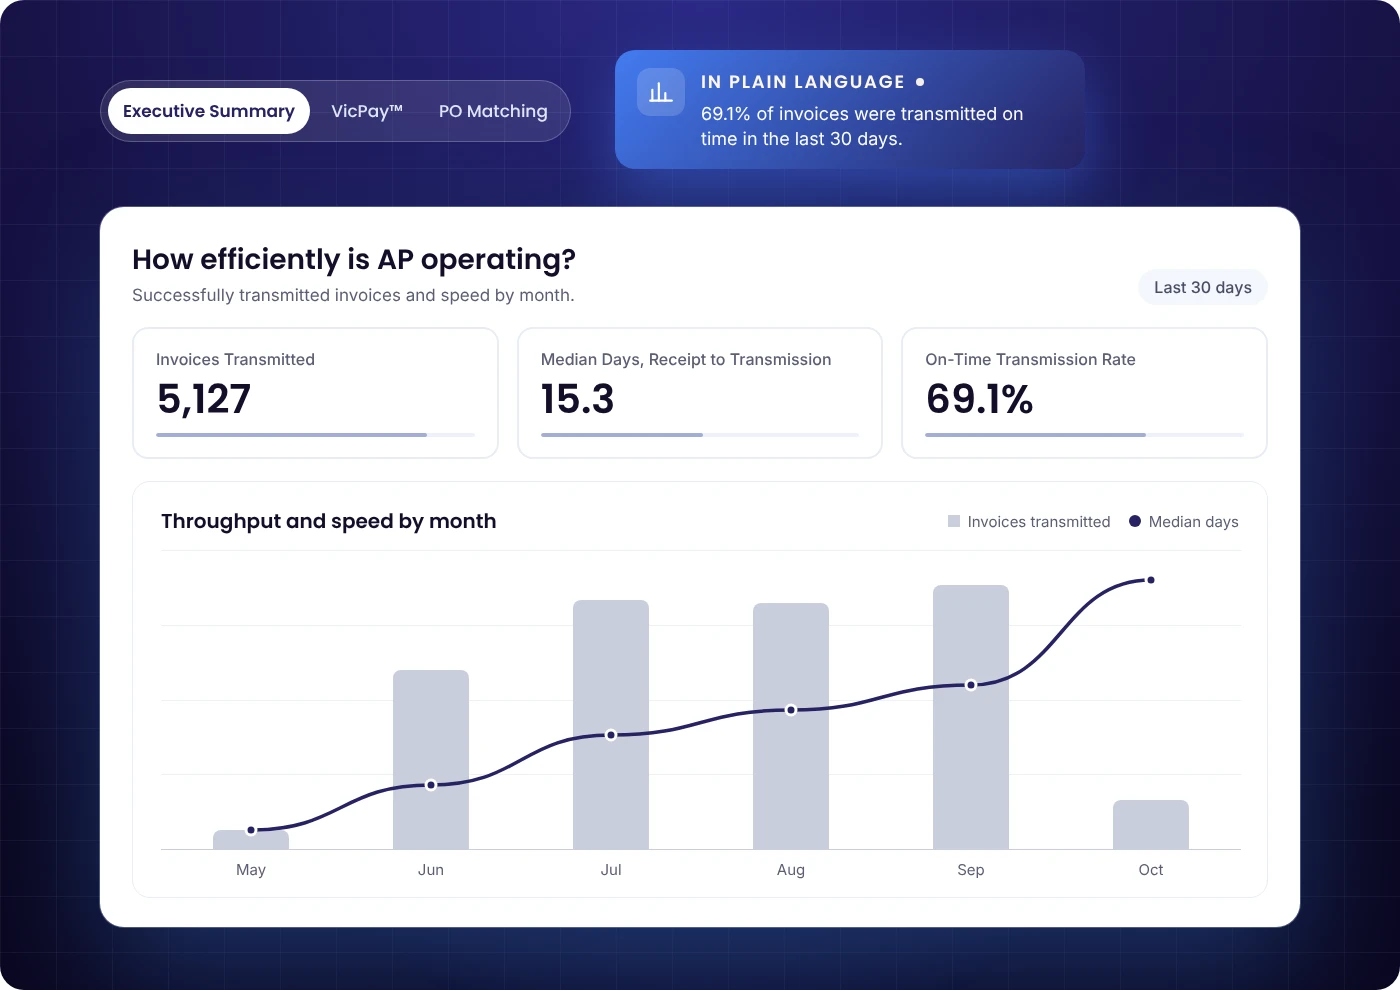
VicAnalytics 2.0 dashboard showing invoices transmitted, median days and on-time rate with a monthly throughput chart
AP analytics, explained

What is VicAnalytics™ 2.0?

VicAnalytics™ 2.0 is the AP analytics experience in the Vic.ai platform. It gives CFOs, controllers and AP teams one standard dashboard with an Executive Summary in plain language, custom reports for deeper analysis, and API access to raw AP data in Power BI, Tableau or a data warehouse. Every metric follows one shared definition.

Why finance leaders choose it

Turn AP data into clear answers, not more reports

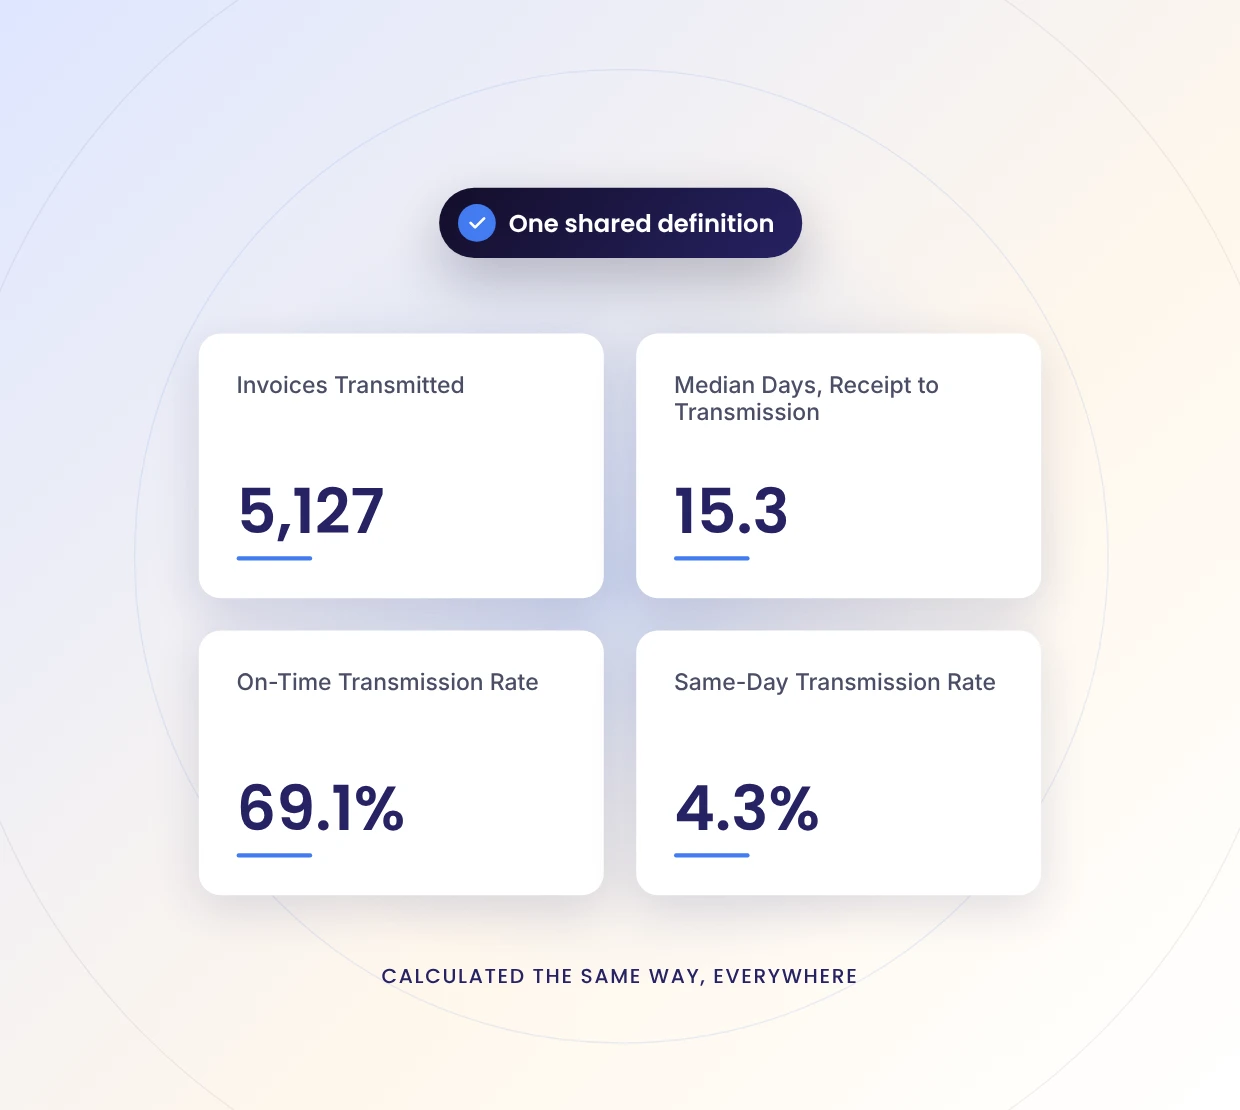
VicAnalytics 2.0 AP metrics, each calculated with one shared definition

Trust every number

  • One shared definition: Every metric is calculated the same way for every team.
    ‍
  • Business rules, built in: Dates, spend and accuracy follow rules defined once in the platform.
    ‍
  • Complete totals: Totals stay accurate, even across thousands of vendors.
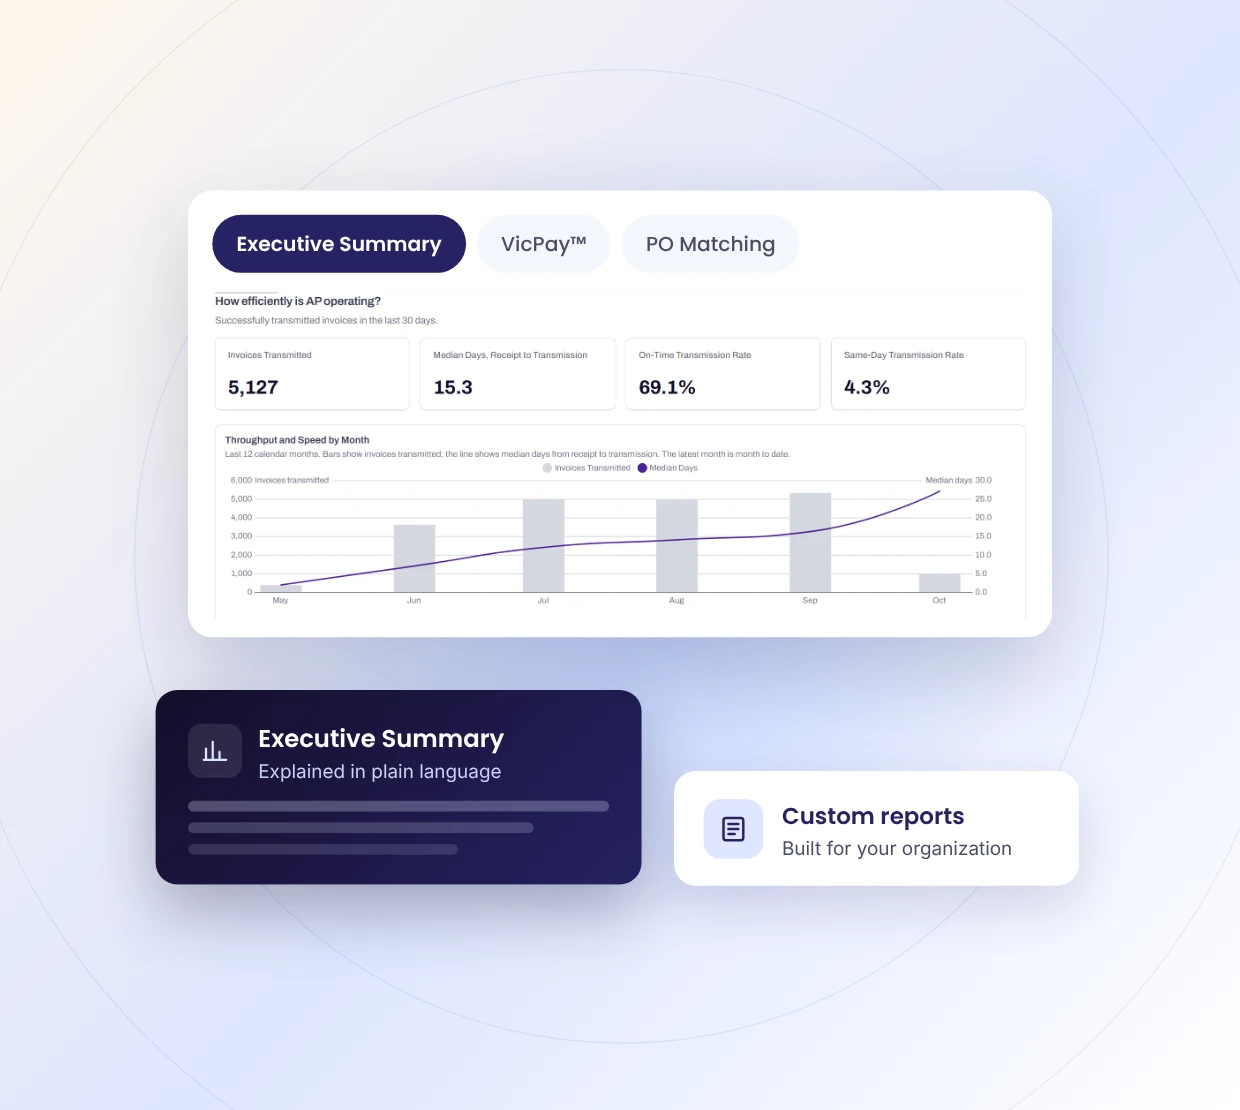
VicAnalytics 2.0 dashboard tabs for Executive Summary, VicPay and PO Matching

See what matters

  • Executive Summary: Key AP metrics, explained in plain language.
    ‍
  • Only the modules you use: One dashboard that shows just your Vic.ai modules.
    ‍
  • Operational views for AP teams: Backlog, approvals, payments and spend at a glance.
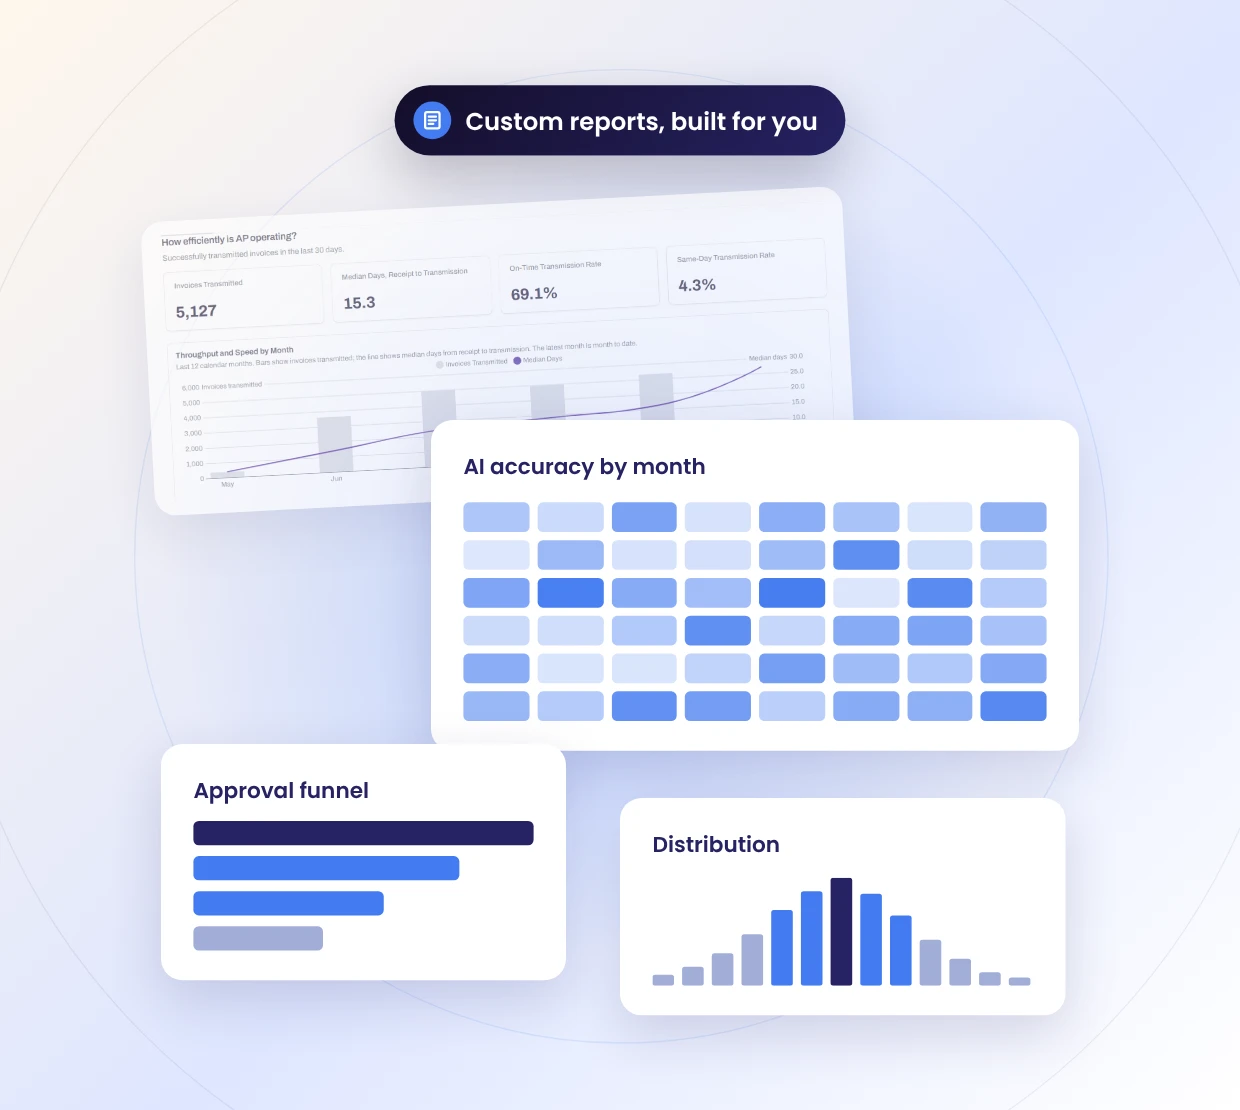
VicAnalytics 2.0 custom reports with heatmap, funnel and distribution charts

Go deeper with custom reports

  • Custom reports: Deeper analysis built for your organization.
    ‍
  • Richer visualizations: Heatmaps, funnels, flows and distributions.
    ‍
  • Fast, focused dashboards: Each tab loads only when you open it.
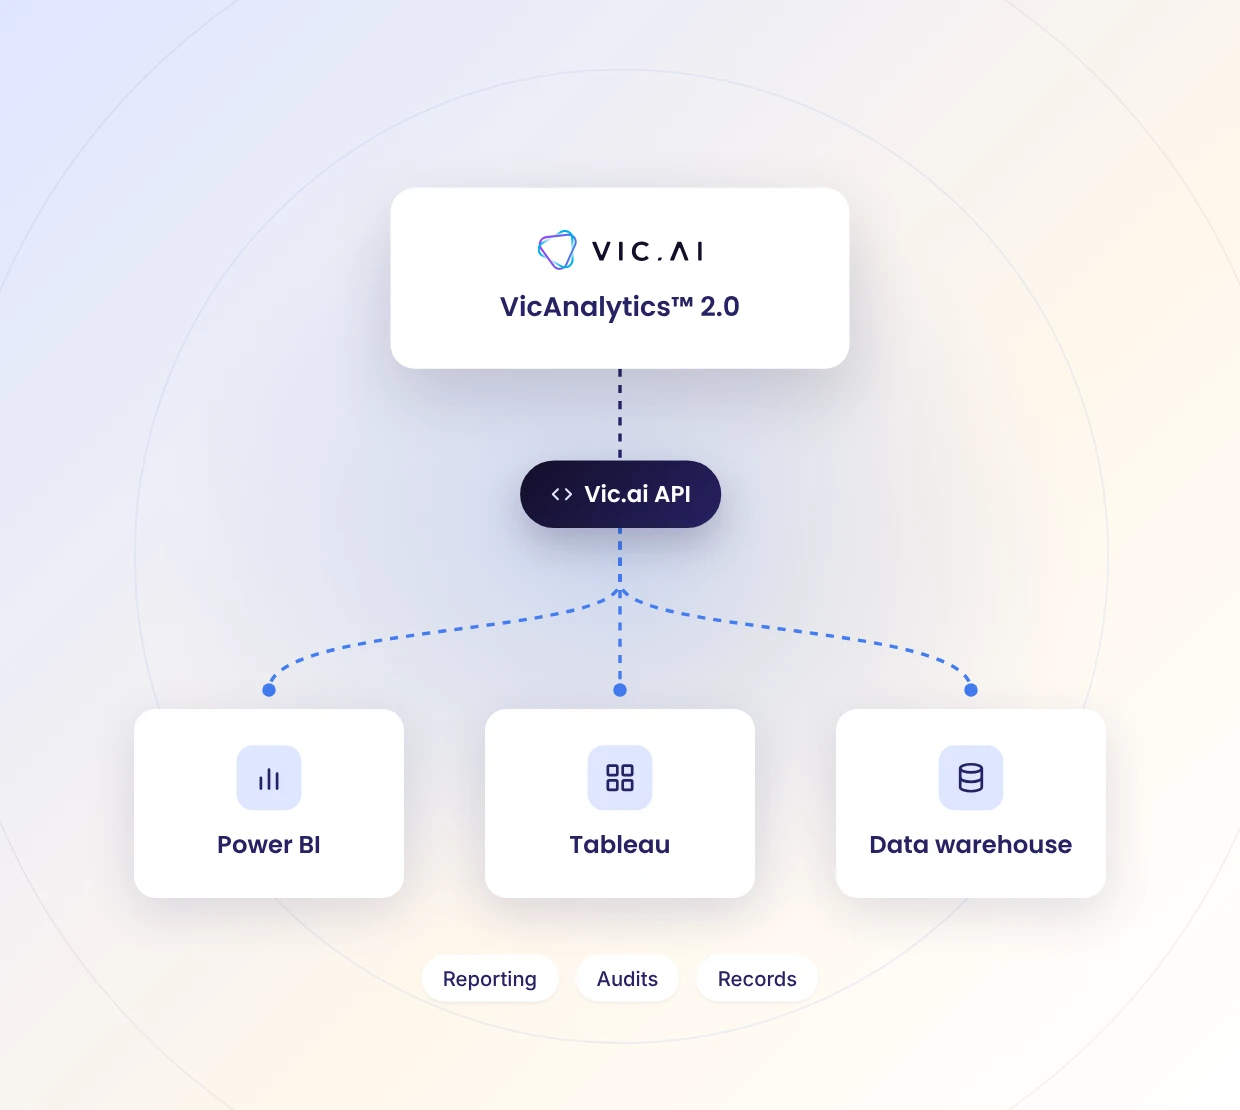
VicAnalytics 2.0 raw AP data flowing through the Vic.ai API to Power BI, Tableau and a data warehouse

Integrate your raw data

  • Your tools, your reporting: Pull raw AP data into Power BI, Tableau or your data warehouse.
    ‍
  • Audits and records: Keep your own copy of AP data.
    ‍
  • Set up with your team: The Vic.ai API is enabled by your Vic.ai team.
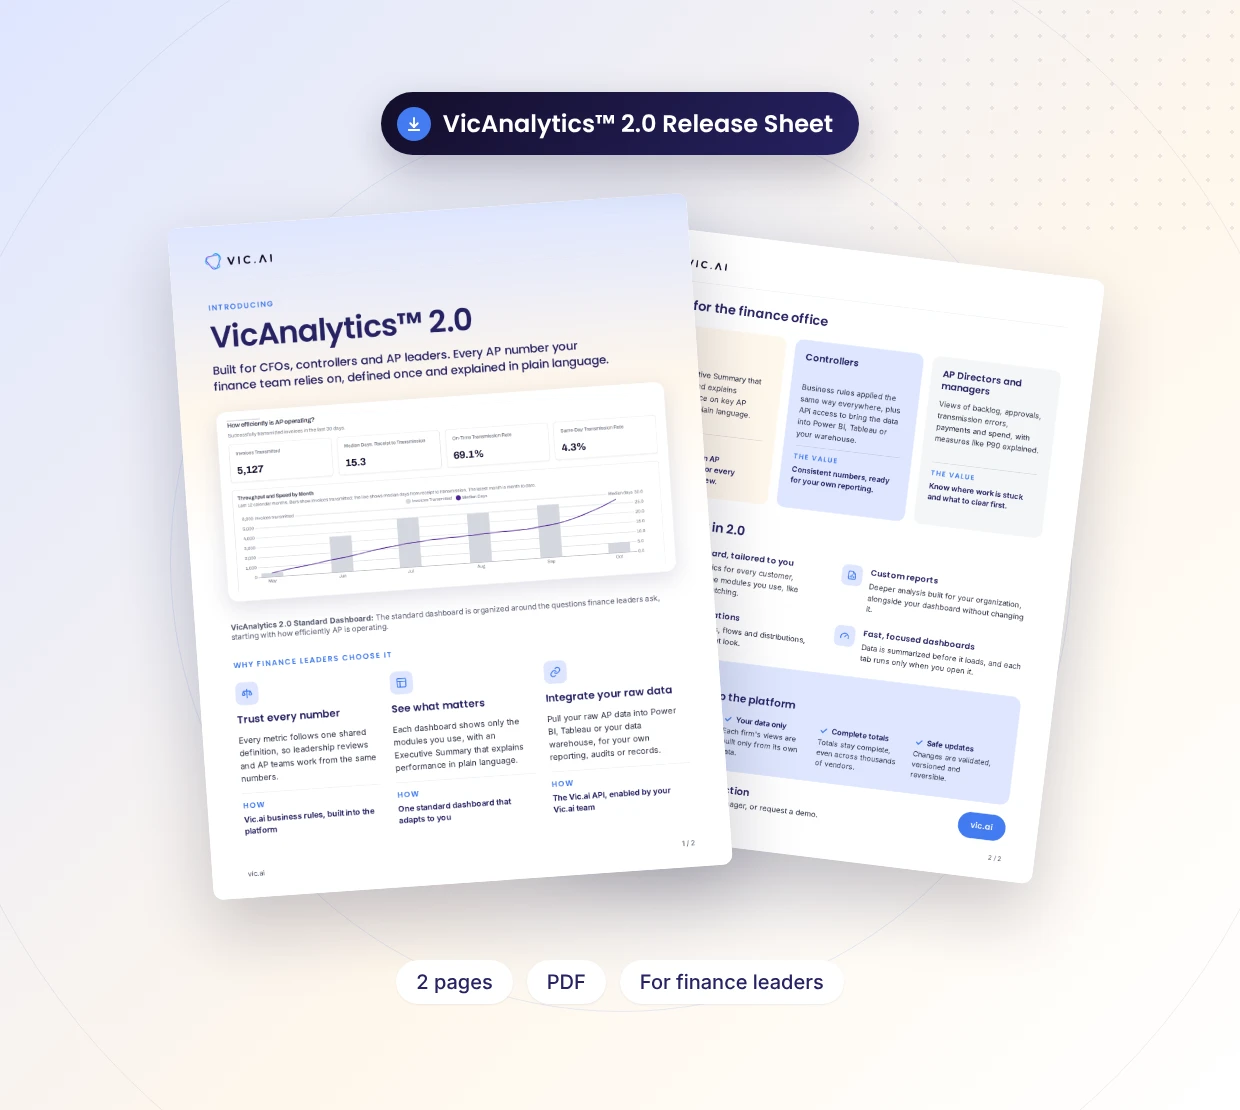
VicAnalytics™ 2.0 Release Sheet
See everything in VicAnalytics™ 2.0 on two pages: what's new, how it serves CFOs, controllers and AP teams, and the controls built into the platform.
Get the release sheet
VicAnalytics 2.0 release sheet, a two-page overview of what is new
Built for the finance office

AP analytics for CFOs, controllers and AP teams

Every customer gets the same standard dashboard, organized around the questions CFOs, controllers and AP teams actually ask.

CFOs

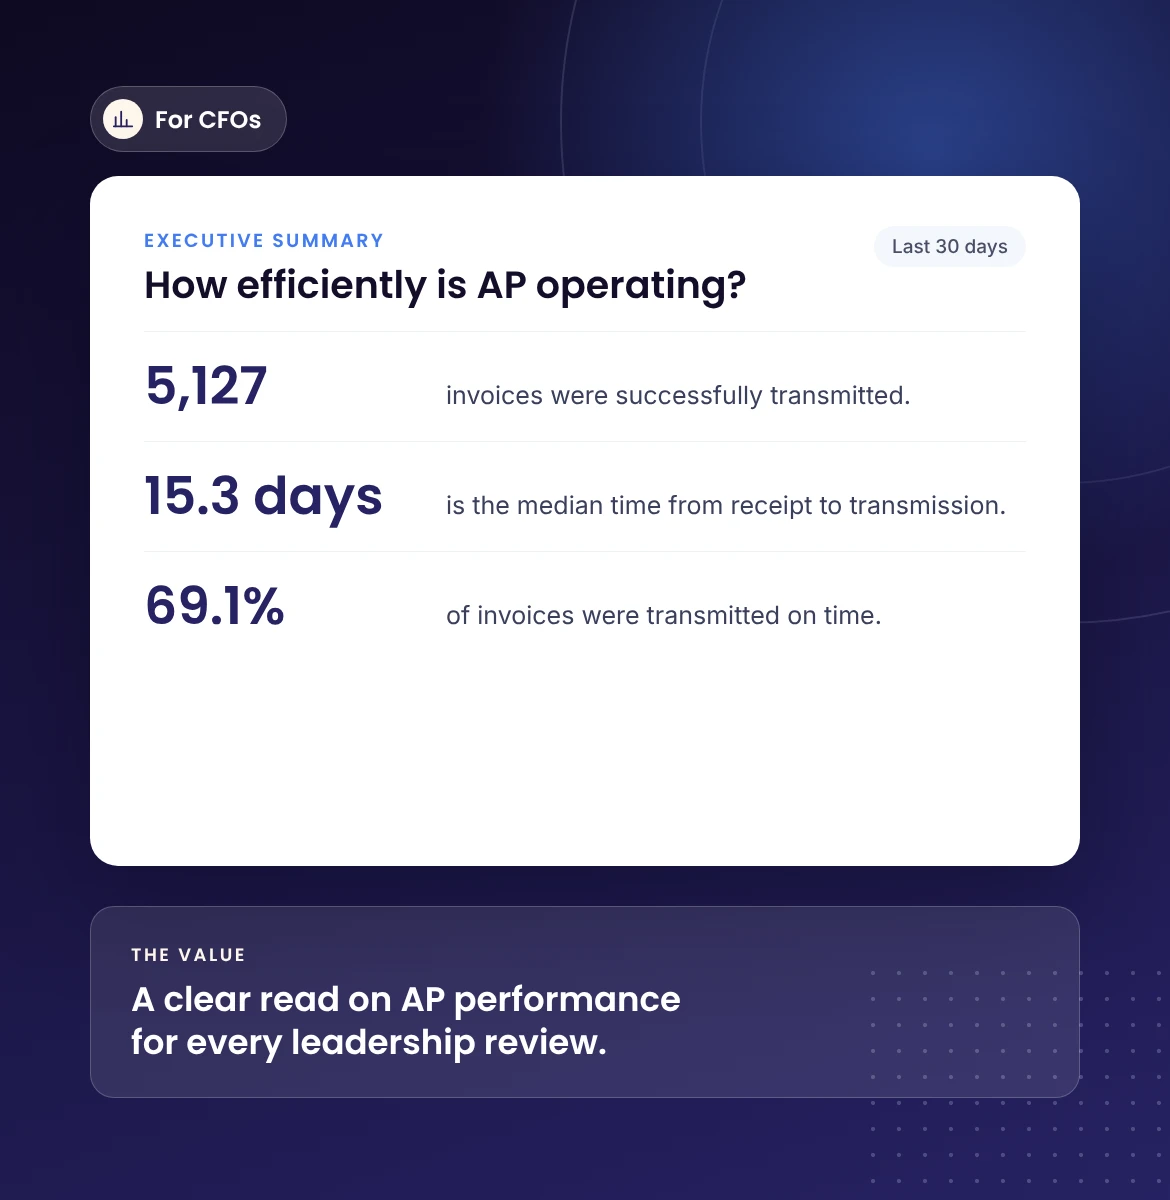
An Executive Summary that defines and explains performance on key AP metrics in plain language, so you get a clear read on AP performance for every leadership review.
VicAnalytics 2.0 Executive Summary for CFOs, explaining key AP metrics in plain language

Controllers

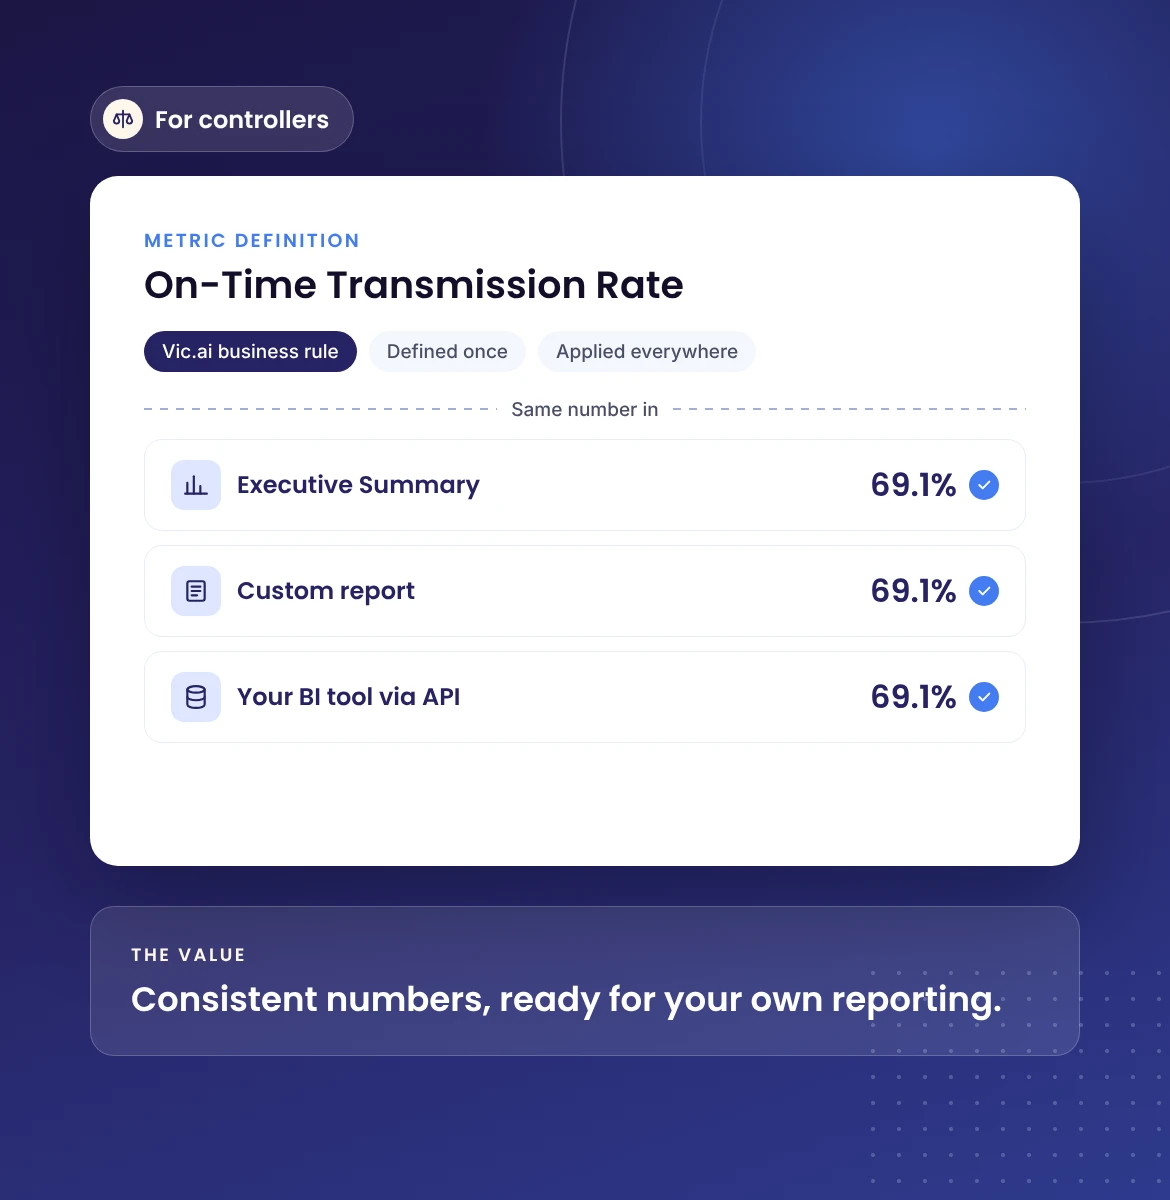
Business rules applied the same way everywhere, plus API access to bring the data into Power BI, Tableau or your warehouse, so your numbers are consistent and ready for your own reporting.
VicAnalytics 2.0 for controllers, with consistent business rules and API access to AP data

AP Directors and managers

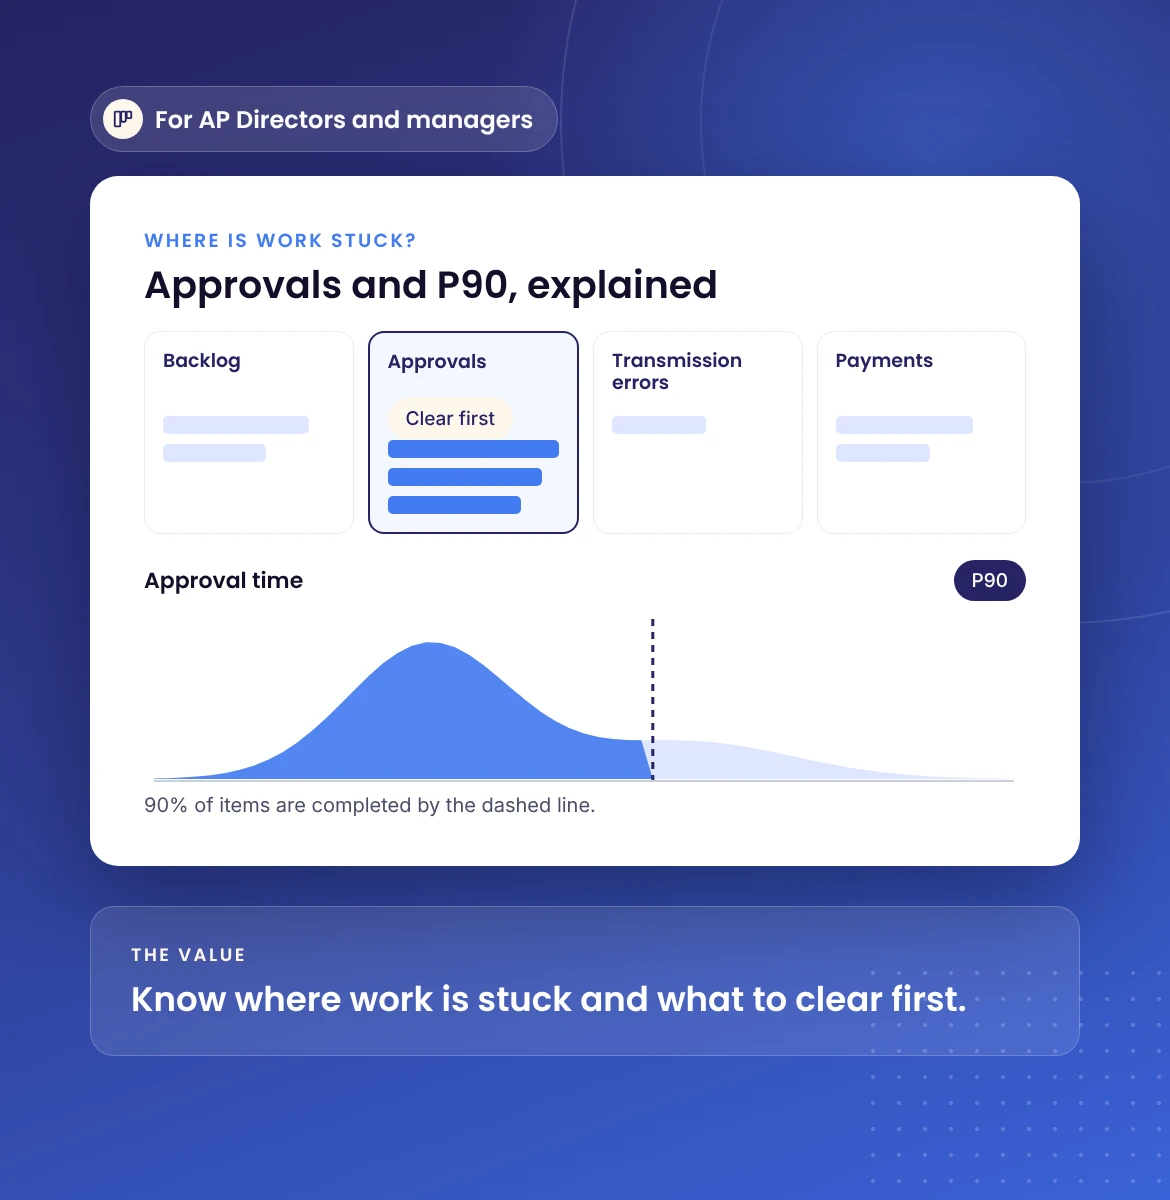
Views of backlog, approvals, transmission errors, payments and spend, with measures like P90 explained, so you know where work is stuck and what to clear first.
VicAnalytics 2.0 for AP Directors and managers, showing backlog, approvals and payments
Under the hood

How VicAnalytics™ keeps AP metrics consistent

VicAnalytics™ 2.0 is built so the numbers you report hold up, from the dashboard to the audit.
Consistent rules
Every metric is calculated the same way, everywhere, with Vic.ai business rules built into the platform.
Your data only
Each firm's views are built only from its own data, and the platform checks this before anything is built.
Complete totals, safe updates
Totals stay complete across thousands of vendors, and every dashboard change is validated, versioned and reversible.
FAQ

Frequently asked questions about AP analytics

What is AP analytics?

AP analytics is the measurement of accounts payable performance, such as invoice volume, cycle times, approvals, accuracy and spend. It shows finance leaders how efficiently AP is operating and where work is getting stuck.

Who is VicAnalytics™ 2.0 for?

It is built for CFOs, controllers, AP Directors and AP managers who need clear, consistent reporting on AP performance, from leadership reviews to day-to-day operations.

Can I use my AP data in Power BI or Tableau?

Yes. The Vic.ai API, enabled by your Vic.ai team, lets you pull raw AP data into Power BI, Tableau or your data warehouse for your own reporting, audits or records.

How often does VicAnalytics™ data update?

Data refreshes overnight, and you can refresh manually from the dashboard when you need the latest view.

What is P90 in AP analytics?

P90 is the time within which 90% of items are completed. It is a more reliable signal than an average, because a few outliers cannot skew it.

What is new in VicAnalytics™ 2.0?

VicAnalytics™ 2.0 adds one standard dashboard that shows only the modules you use, an Executive Summary in plain language, custom reports, richer visualizations like heatmaps and funnels, and faster dashboards.

You might also be interested in
View all resources

Ready to see Vic.ai in action?

Schedule a meeting with our team to learn more and get started on your path toward more enlightened Accounts Payable.